


OpenPrescribing Hospitals: multi-product analyses
- Posted:
- Written by:
- Categories:
This article is part of a series: OpenPrescribing Hospitals: Analyse
In a previous post, we showed how you can run custom analyses across different organisational levels on OpenPrescribing Hospitals. This was one of the most common requests for the Analyse feature from our users. Another, was to support analysis of more than one product at a time. This is now also possible — here’s how to get started with multi-product analyses.
Search for products by name, ingredient or ATC
The first version of the Analyse feature supported searching by product name or code. This was fine for single product analyses, but for analyses of multiple products, we wanted to allow searching by other features of the product. You can now additionally search for products by the ingredients they contain, or where they appear in the Anatomical Therapeutic Chemical (ATC) classification. If you aren’t sure you can look up all of these details using the Product Lookup feature,

This allows selection of all products with a specified ingredient or all products that appear at or below a specified level of the ATC system.
The challenge of analysing multiple products
The raw data used for OpenPrescribing Hospitals contains a wide range of units of measure for different products. This makes comparing the usage across medicines challenging, as the units may not always be comparable (e.g. a tablet may not be the same as a vial of the same product type). As a result, we’ve calculated alternative measures of quantity that are more appropriate for certain products. We’ve described these quantity types and when they are useful in our blog series, Measuring Quantity. You can also see the quantity types available for each product using the Product Lookup feature.
Choosing a quantity type
To avoid users having to decide on the most appropriate quantity type each time they want to run an analysis, we make a recommendation of the most appropriate choice based on the products that have been selected (you can read more about how we make that choice in our blog post, Choosing a quantity type for your analysis on OpenPrescribing Hospitals).

Analyses default to the recommended quantity type, but you can manually select a different quantity type in the advanced options section of the analysis builder if you prefer.
What do the results show?
As before, the first section of analysis results shows details about the products being analysed. However, there are a few differences.
First, as the alternative quantity types can not be calculated for all products, some products may be excluded from an analysis. In the example below showing an analysis of all apixaban and rivaroxaban products, DDD quantity (the recommended quantity type chosen for this selection of products) can’t be calculated for the initiation pack that contains both rivaroxaban 15mg tablets and rivaroxaban 20mg tablets, as there are two strengths of tablets in the same pack.

Second, checkboxes next to each product allow you to easily remove a product from the results without having to completely respecify the analysis, which can be useful when analysing a large number of products.
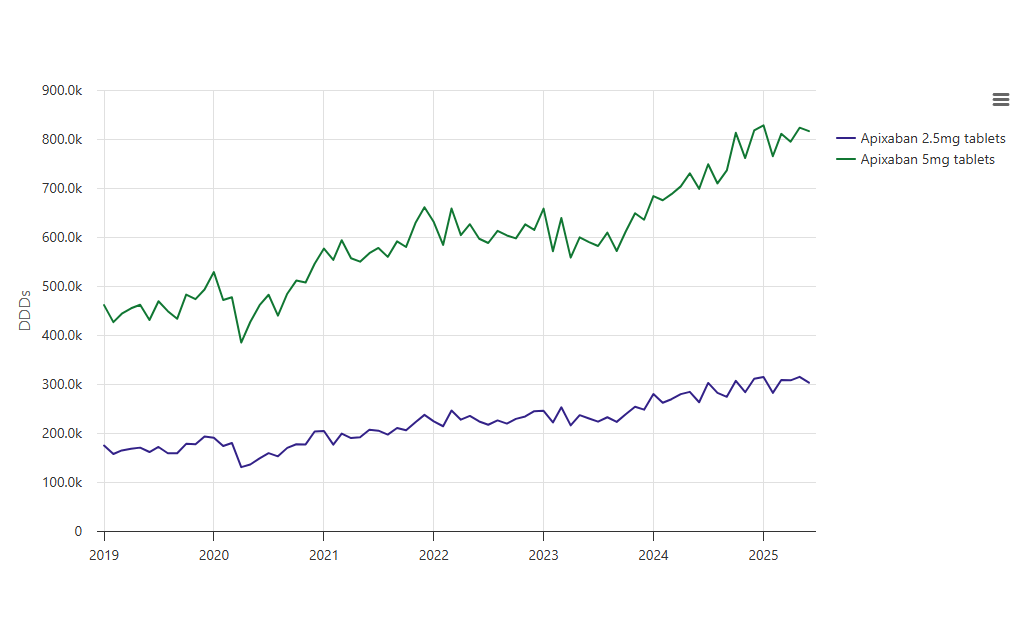
The next section of the results is a time series chart showing the trend in issuing of the selected products over time. With the introduction of multi-product analyses, there are additional charts available, depending on the products selected. These include the following breakdowns:
- Product
- Product Group
- Ingredient
- Unit
These modes are available if the selected products have more than one unique value for these breakdowns. In an analysis of apixaban and rivaroxaban, which includes multiple products, we can see a breakdown of issuing by product. For these modes, if trusts were selected in the analysis builder, the results will be restricted to data for those trusts, otherwise they will be aggregated across all trusts in England.

Finally, as we showed in the previous post, there is a summary table showing the total issuing quantity across different time periods. These totals reflect totals for the chosen chart view mode. For example, if product mode is selected, the totals reflect the total issuing for each product. As with the charts, if individual NHS trusts are selected when specifying an analysis, the totals here are calculated across those trusts.

Above, we’ve outlined what’s now possible with the Analyse feature on OpenPrescribing Hospitals. We think this allows for a much wider range of analyses, so we’re excited to see how it is used. If you have any feedback or questions please let us know!