


Running the OpenSAFELY Output Checking Service
- Posted:
- Written by:
- Categories:

This article is part of a series: Output Checking
- The ‘Five Safes’ Framework and applying it to OpenSAFELY
- ‘Safe Outputs’ and Statistical Disclosure Control in OpenSAFELY
- The Opensafely Output Checking Service
- Running the OpenSAFELY Output Checking Service
Having discussed what output checking is and the OpenSAFELY output checking service, here we will present some of our findings on what running an output checking service is like.
Overview
The OpenSAFELY platform has grown rapidly. There are now over 150 projects within OpenSAFELY from over 20 different organisations. With this, there has been increasing use of our output checking service. We have now trained over 40 people through our output checking training (see previous post), including collaborators from LSHTM and University of Bristol. To help both us and others running similar output checking services, we thought it would be useful to describe some key metrics of our output checking service. Below, we describe:
- Number of review requests over time
- Number of files in each review request
- Number of review requests per project
- Review turnaround time
- Time spent reviewing
Number of reviews
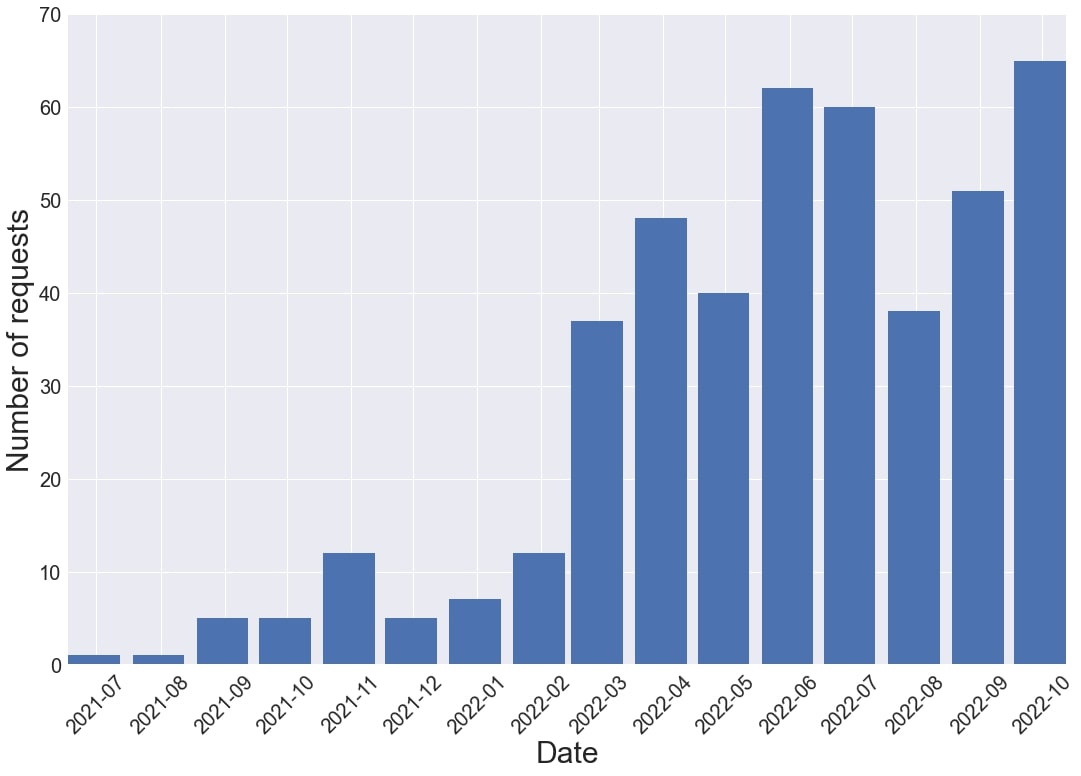
Between July 2021 and October 2022, there were a total of 447 output review requests. The number of requests received each month, shown below, has been steadily increasing from <10 per month in 2021 to more than 40 per month by the latter end of 2022. This increase is due largely to an increasing number of projects using OpenSAFELY via our co-piloting programme.
Number of files per review request
Minimising the data requested for release is a key principle to reduce disclosure risk in OpenSAFELY. However, this is a difficult metric to track for a couple of reasons: 1) OpenSAFELY supports the release of a wide range of different file types from tables to full reports with multiple embedded results. These file types require varying time to review. 2) Researchers may choose to split their outputs up differently according to their needs, which can result in a varying number of files for a similar review workload. With this in mind, the number of files per review request can’t be interpreted directly as an indicator of risk or review workload, but it is at least a useful proxy.
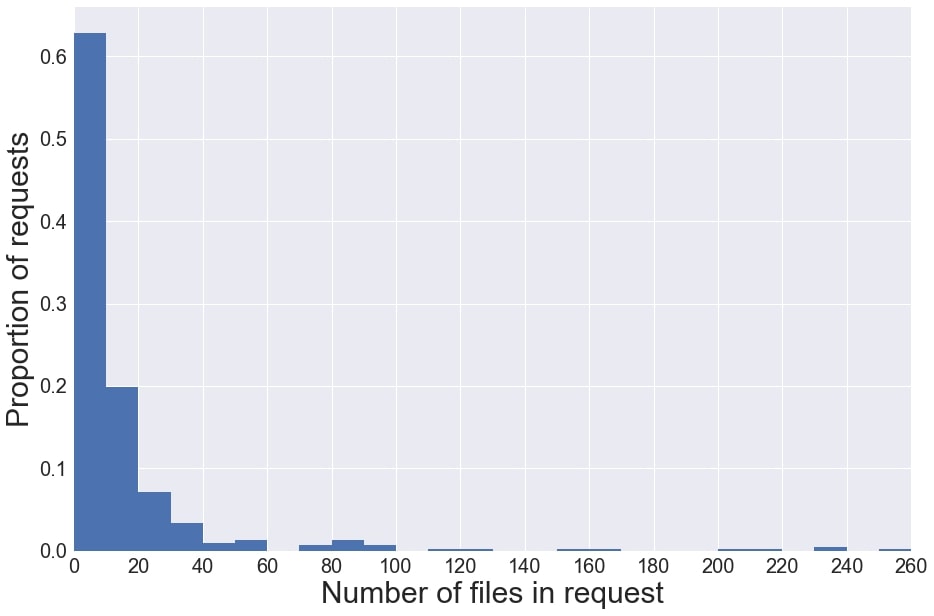
The distribution of the number of files per review request is shown below. The median number of files per review request was 5, with 75% of review requests containing < 13 files. A small proportion of review requests contained more than 30 files which can be warranted if a project hasn’t had outputs released throughout it’s lifespan or it contains lots of supplementary data.
Number of requests per project
There are lots of different types of projects active in OpenSAFELY, ranging in complexity and scale. It is therefore expected that the number of requests per project would vary. Whilst we request that projects group their outputs together where possible, we accept that projects are dynamic; intermediate results need to be shared with collaborators and updates may be required in response to reviewer comments.
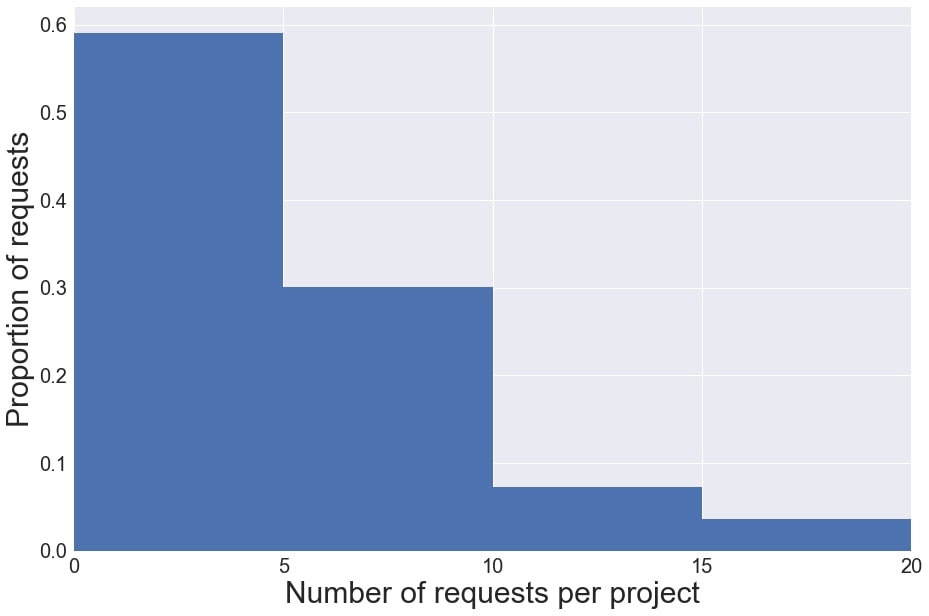
Our analysis showed that across 84 different projects, the median number of requests per project was 2. ~60% had <= 5 reviews. However, it should be noted that a lot of the projects in OpenSAFELY are currently active, so this may underestimate the final count of requests.
Time to review
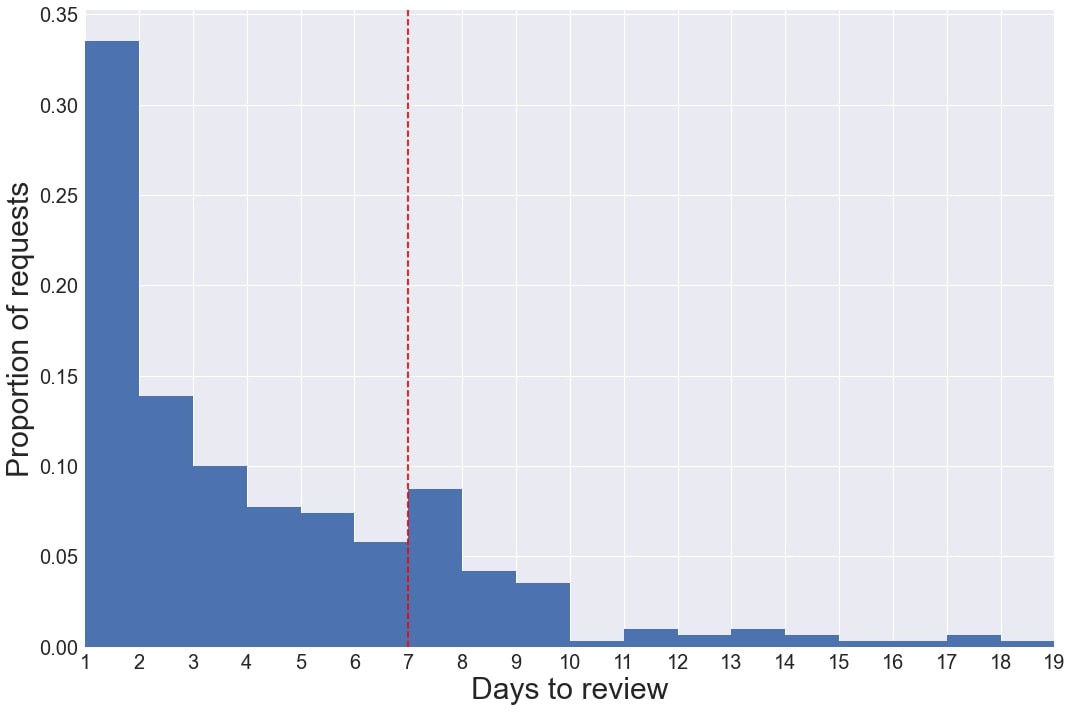
When establishing the OpenSAFELY output checking service, we aimed to complete reviews within 7 days of them being requested. Completion here is the time taken to send a response back to the requester, rather than the time between request and release of outputs (which could consist of multiple reviews). This is similar to other output checking services such as the ONS secure research service which has a turnaround time of 5 days. The below figure shows the time taken for reviews in OpenSAFELY. 91% of reviews have been completed within the 7 day time window, with 49% being completed within 2 days.
Time spent reviewing
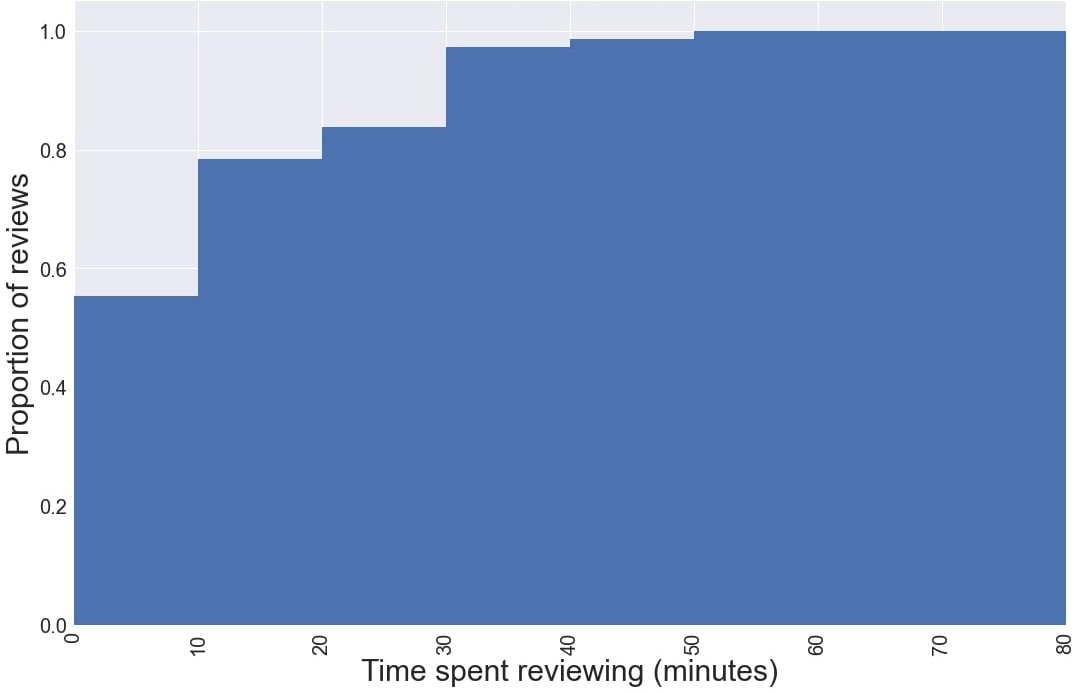
The number of files per review request shown above gives a sense of the scale of review requests, but due to the variety of different file types and results produced using OpenSAFELY, we found it difficult to get a real understanding of exactly how long reviews take. To get a better grasp of this, between Aug 2022 and Oct 2022 reviewers were asked to log how long they spent on individual review requests. This data was collected for 75 review requests, the results of which are shown below. ~55% of reviews took less than 10 minutes and ~95% took less than 30 minutes, which shows that the majority of reviews can be cleared quickly.
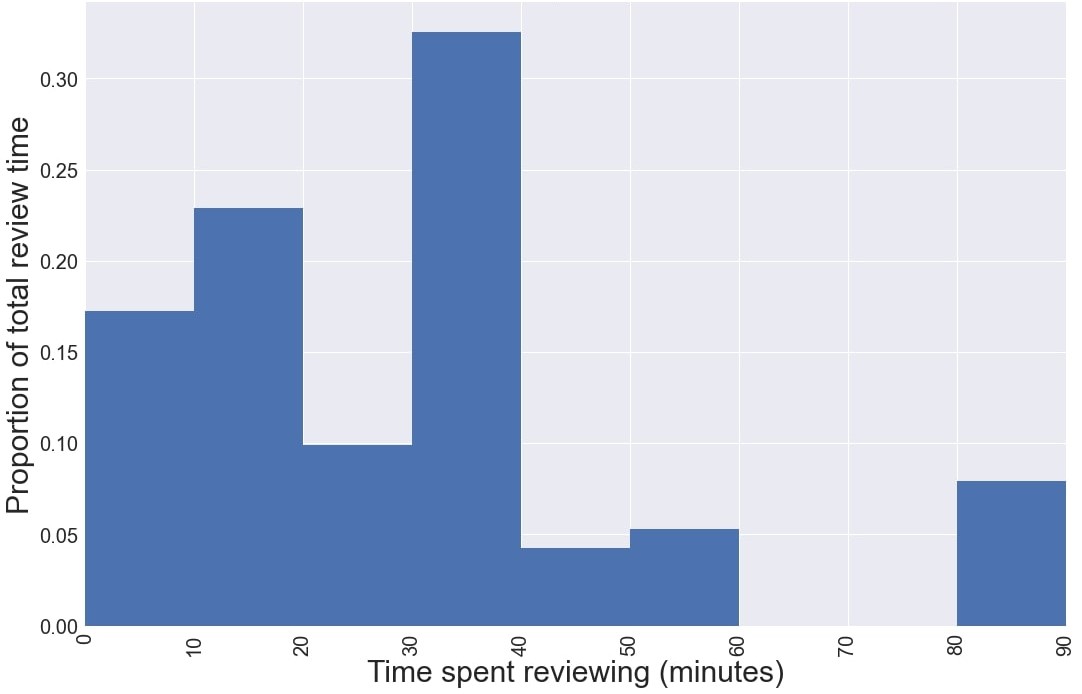
The figure below shows the proportion of total reviewer time taken up by review requests of different intervals. This shows that 40% of total reviewer time is spent on review requests taking less than 20 minutes and just over 30% is spent on review requests that take between 30 and 40 minutes.
Summary
The metrics presented above give a sense of the workload involved with running an output checking service. In the future, we hope to collect more data on output reviews to further understand and improve the service. This includes analysing review time for different output types commonly produced in health data research (e.g. counts tables, modelling outputs etc) and also understanding the output types that most commonly require further action from researchers to be made safe for release.