An Update on Our Co-piloting Programme: How Have We Grown?
- Posted:
- Written by:
-
- Lisa Hopcroft
- Categories:

This article is part of a series: Co-Piloting
- OpenSAFELY co-pilot programme: assisting users on their OpenSAFELY journey
- Conducting Research Using OpenSAFELY: My Experience of the Co-pilot Service
- An Update on Our Co-piloting Programme: What's New?
- An Update on Our Co-piloting Programme: How Have We Grown?
Earlier this year, we published a blog about how our co-piloting programme has changed over the last 18 months: the new resources, processes and events that we have added along the way as a result of interacting with our pilots.
Co-piloting is a fantastic way for us to realise the benefits of OpenSAFELY in new areas of EHR (electronic health records) research and increase the productivity of our platform. We learn from users—what works and what doesn’t (yet)—and use that to drive and prioritise development. As a result, we build an analysis platform that works for more people, faster.
In this blog post, we take some time to describe the co-piloting programme in numbers, to give an idea of the scale of this programme, who our co-pilots are and who we are working with. And because we are data scientists (!) much of the content of this post was informed by a quantitative analysis of data downloaded from our job server. This analysis was implemented as an Rmarkdown document and is available to view in this GitHub repository, in this folder specifically. The data was downloaded from our job server in February 2023.
How many co-pilots are there?
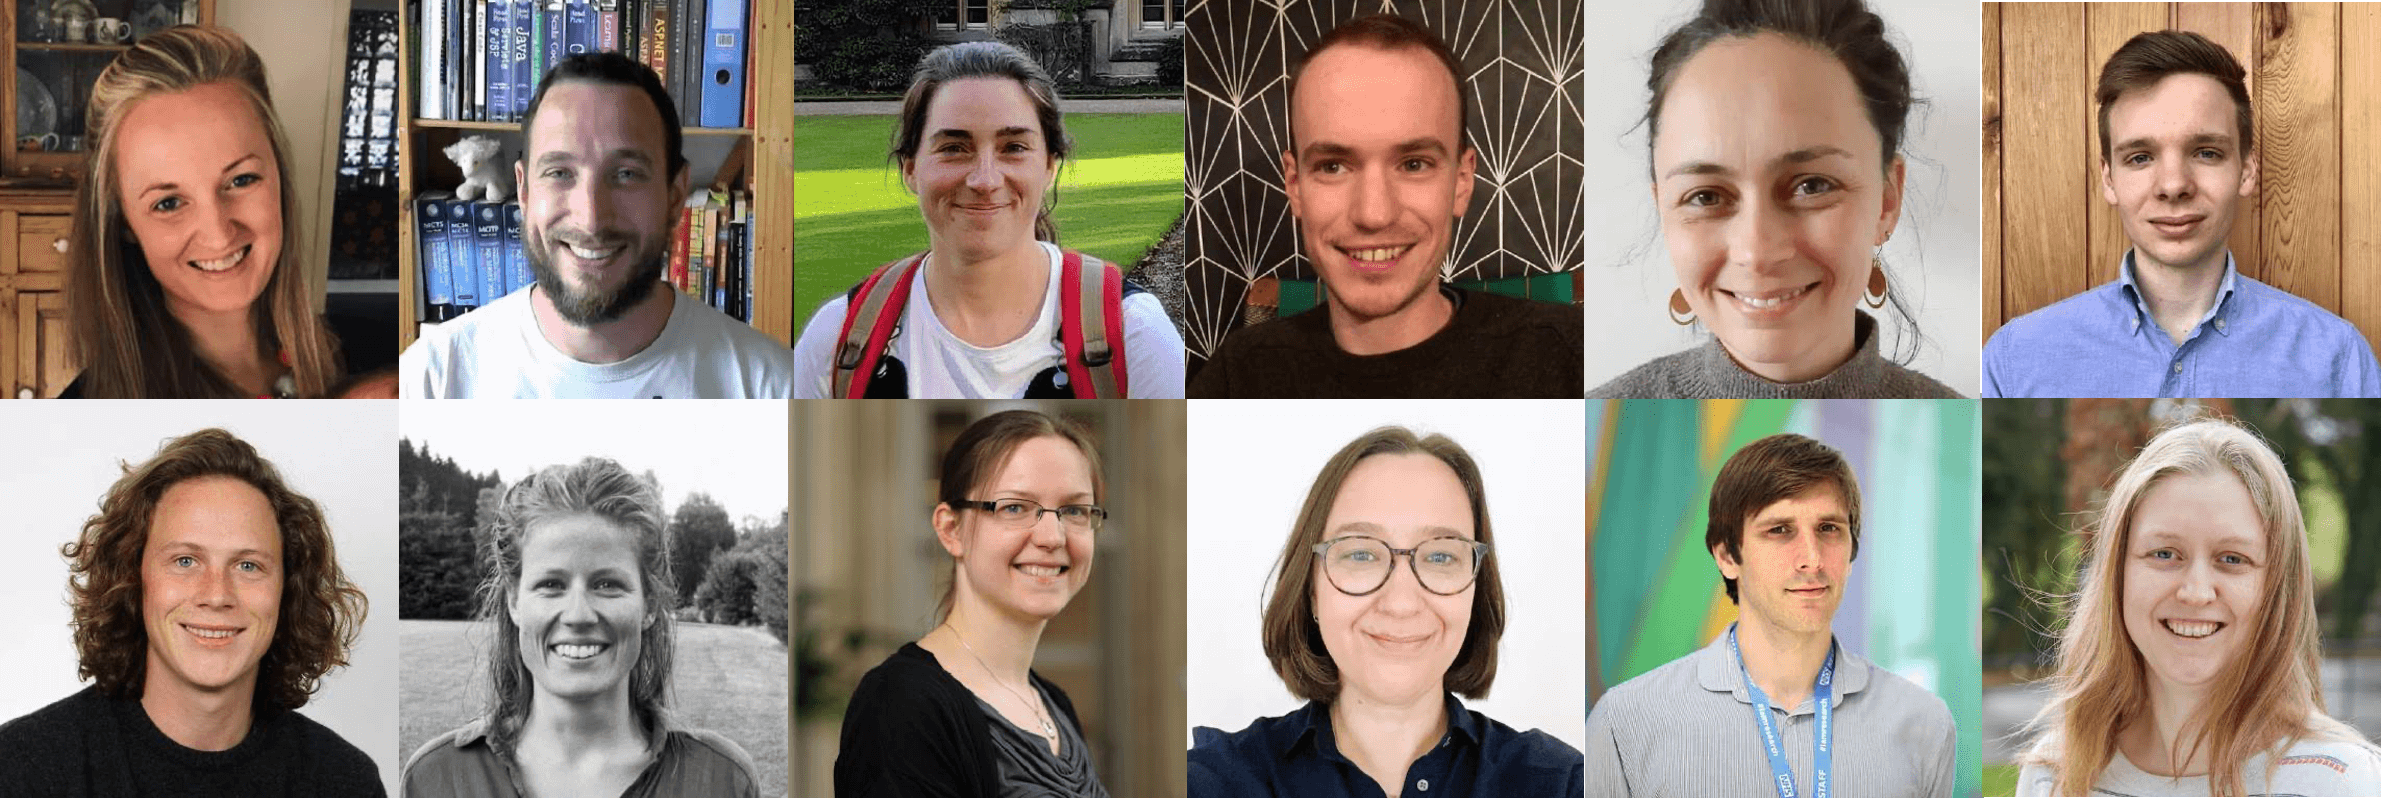
13 Bennett Institute staff have acted as a co-pilot on one or more project in the past, and we currently have 12 that are ready and willing to help. Here are some of our friendly faces!

When new co-pilots are identified, we typically have a more experienced co-pilot waiting in the wings to provide advice and support.
How many external users do we have?
We have 56 external users of OpenSAFELY and 24 of these users have worked on more than one OpenSAFELY project. Not all of these 56 users will have been co-piloted: typically there is one member of the external group—the person who is primarily responsible for implementing and running analyses—will be co-piloted, but more users will be given access to our jobserver to view the results of those analyses, once released.
How many projects have been co-piloted?
We currently have 43 projects being supported by one of our twelve active co-pilots. These projects are split across 21 organisations (some of these projects will be from different groups within the same organisation, though we have had pilots return to start new projects following their first experience):
| Organisation | Number of projects | Number of workspaces |
| University of Bristol | 8 | 37 |
| NHSE/I | 6 | 9 |
| NHSX | 4 | 11 |
| ONS | 2 | 4 |
| PHC, University of Oxford | 2 | 2 |
| PrescQIPP | 2 | 2 |
| QMUL | 2 | 2 |
| The UK Renal Registry | 2 | 3 |
| University of Liverpool | 2 | 3 |
| University of Manchester | 2 | 35 |
| GraphNet | 1 | 4 |
| ISARIC | 1 | 1 |
| King’s College London | 1 | 1 |
| Nuffield Trust | 1 | 2 |
| Public Health England | 1 | 2 |
| Royal Devon & Exeter NHS Foundation Trust and University of Exeter | 1 | 2 |
| UKHSA | 1 | 1 |
| University of Glasgow | 1 | 1 |
| University of Leeds | 1 | 1 |
| University of Nottingham | 1 | 1 |
| University of Surrey | 1 | 1 |
| Total | 43 | 125 |
The way that our system works, one project can consist of multiple workspaces (read more about this in our docs). Multiple workspaces are useful where one project has separate components, or where additional, alternative analyses need to be carried out (e.g., sensitivity analyses). Also included in the table above is the number of workspaces that exist for each organisation.
What’s next?
Generating these counts and tables has been useful in understanding how far our co-piloting programme has come since launching 18 months ago. But we’re keen to dig deeper into the data to understand how well our co-piloting programme is working and how it could be improved. Our next step is to write a detailed academic paper with a thorough analysis of our co-piloted projects, so keep an eye out for that later this year.


