OpenPathology: Seasonality in Haemoglobin test results
- Posted:
- Written by:
- Categories:

In our initial analyses of pathology data from the South West for our OpenPathology.net project, we have noticed subtle but consistent variation in haemoglobin test results throughout the year. Haemoglobin (Hb) levels falling below certain threshold values typically give a diagnosis of anaemia.
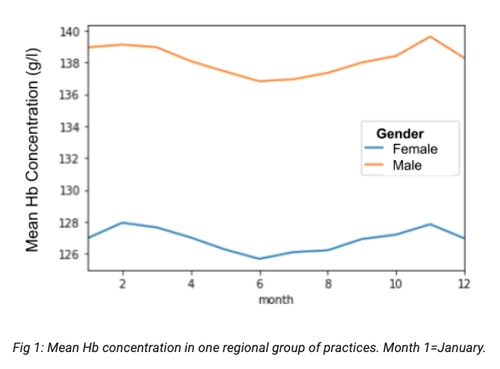
In the following regional sample we see that the mean Hb concentration across both males and females differs by 2-3 g/l between the summer low and the winter peak:

To put this in context, adjustments to the cutoff point for anaemia are documented for altitude (+2 to +67 g/l), smoking status (+3 to +7 g/l) and pregnancy (-10 to -15 g/l) [1], and haemoglobin levels also vary with age. So, the seasonality we see is relatively small and, in the context of ongoing monitoring of an individual patient, likely to be hardly noticeable.
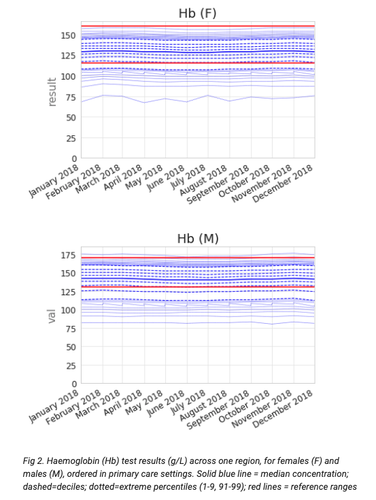
However, over the whole tested population, it seems likely that more patients will fall under the threshold and be flagged as anaemic in summer compared to winter. We can see this effect more clearly by plotting the distribution of test result values in our region, and comparing these with the reference range limits:

We can see that in summer approximately 20% of test results for women are below the reference range (i.e. “anaemic”), but only around 18% in winter. Taking a practice with 10,000 patients requesting 500 tests per month, assuming 300 of these are for women, this could represent an additional 6 patients (60 vs 54) being flagged as anaemic in a summer month compared to winter.
Is this seasonality clinically significant? There are several sources of variation which can introduce uncertainty in test results (which we will discuss in several other blogs), and this seasonal effect appears to be another contributor, though potentially a minor one.
It is worth noting that the consequences of even mildly abnormal results can be significant — causing considerable worry for patients (e.g. video below), as well as potentially unnecessary further testing and treatment.
What could be causing it?
Sampling?
- Perhaps the population being tested by GPs varies by month, and more people with low haemoglobin happen to be tested in summer.
- A sampling effect could also be caused by our current small sample size — we’d love to include more data! (How to get involved)
Degradation?
- Any degradation of haemoglobin in the blood sample during transport or storage could reduce the resulting test result value, which could feasibly be accelerated in warmer conditions.
- We see an artefactual effect in potassium tests, where diffusion of potassium in and out of red cells is affected by temperature.
- However, there is no obvious documentation of an issue with haemoglobin stability.
Natural adaptation to temperature?
- Seasonality in haemoglobin levels has been noted in the literature, often in people tested routinely, including blood donors, pregnant women [2] and thalassemia patients.
- For example, more blood donors are turned away in summer due to low haemoglobin concentrations [3,4,] and thalassemia patients also report lower haemoglobin levels in summer5.
- The effect has been attributed to increased plasma volume in warmer conditions, i.e. blood becomes more “dilute” to help the body acclimatise to warmer weather [6], but absolute haemoglobin levels remain unchanged.
- This could mean that patients dropping into the “anaemic” category in summer in fact have sufficient haemoglobin levels.
- Interestingly, the observation of seasonality in on-the-spot testing (such as at blood donation centres), would appear to rule out the possibility of there being a significant issue with haemoglobin stability. These observations also make it unlikely that it is a sampling issue.
What next?
We’re interested in investigating this effect across more regions, as we import more data into the tool. If your region would like to get involved please let us know. Or if you have any thoughts on this topic do get in touch.
There are many other factors that can contribute to variation in test results. Our next blog series will take a brief look at some of the problems inherent in how we define a “normal” result, and how we consider variance in measurements.


