


OpenPathology: Issues with reference ranges — Part 2
- Posted:
- Written by:
- Categories:
This article is part of a series: OpenPathology: Issues With Reference Ranges
- OpenPathology: Issues with reference ranges — Part 1
- OpenPathology: Issues with reference ranges — Part 2
- OpenPathology: Issues with reference ranges — Part 3
This is the second installment in our series of commentaries on reference ranges used to interpret pathology test results. Here we describe two issues relating to how meaningful reference ranges are.
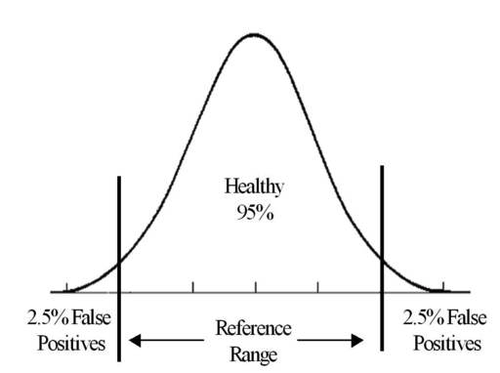
Reference ranges are usually indicators of statistical outliers in a healthy reference population
The most common type of reference range is defined as the interval between which 95% of the values of a healthy reference population fall into. In other words, 2.5% of the time, healthy people will have haemoglobin concentrations less than the lower limit.
An interesting implication of this is that the greater the number of different tests performed, the greater the chance of finding an “abnormal” result in a healthy person. In primary care, it is common practice to order “batteries” of tests in one go: take one sample of blood, and get lots of results. Most blood samples are sent with a request for “Full Blood Count”, which often includes 16 or more tests (including haemoglobin).
Statistically, testing 16 things each with a 5% chance of being “abnormal” means there is a 56% chance that at least one of these tests will be “abnormal”, but not necessarily indicating anything clinically significant. This is why performing full blood counts as part of routine screening is not recommended. The 2017 Cochrane review on this topic stated:
“Up to 11% of results are abnormal but less than 1% of results require >management change. It is unclear which patients benefit and serious disease is >almost never found.”
Similarly, “health tests” (available privately) are likely to often give some “abnormal” results in healthy people, leading to increased consultations and further testing in the NHS, as reported in the Sunday Times recently.
Instead, most tests should be ordered in a targeted way to avoid chance findings of clinically insignificant results, leading to unnecessary follow-ups and patient anxiety.
The final complicating factor is that patients presenting themselves to doctors are generally not a normal, healthy population. In a cohort with a high prevalence of disease, the predictive value of a positive test result is considerably higher than in a healthy cohort.
Reference ranges are unlikely to be adequately sensitive in most cases
In the previous blog about uncertainty in test results, we visualised a single result with bars indicating uncertainty, like this:
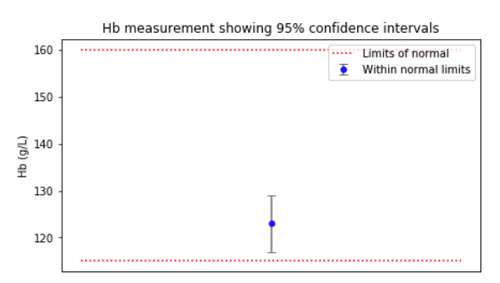
Every healthy person’s setting point is different. This is called the “between-subject” variation, and is the basis for calculating reference ranges: only the extreme outliers are considered “abnormal”. In other words, in a sample of one hundred healthy people, the blue dot above would appear outside the red lines 5% of the time.
The confidence bar in the figure above, on the other hand, shows the within-subject variation: we can expect one healthy individual’s true haemoglobin level to be somewhere within that range 95% of the time.
When within-subject variation is very small as a proportion of the between-subject variation, that test is said to have “high individuality”. The problem with such tests is that a result that is highly abnormal for one individual is still very unlikely to fall outside the reference ranges, because it is not highly abnormal for the population as a whole.
It happens that the vast majority of common tests have high individuality, which means:
- The practice of repeating unusual results that are close to the limits of a reference range is of limited value;
- It is generally agreed that population-based reference values are of limited value in the detection of unusual results for an individual.
A better way to identify abnormality in such cases is to repeat a test with a new specimen and see if it changes enough to be significant. However, despite wide agreement that reference ranges are often inappropriate, they remain the primary way labs provide interpretation alongside results to GP. The lack of progress here may in part be because these concepts are hard to explain and interpret.
The next part of the series is about variation between labs. Read on…